
Training Project Overview
Navigate your training project dashboard to view insights, manage workflows, and track model training progress in Datature Vi.
The training project overview is your central dashboard for a single training project. It shows live training insights, lists all workflows in the project, and provides quick access to runs, models, and project settings.
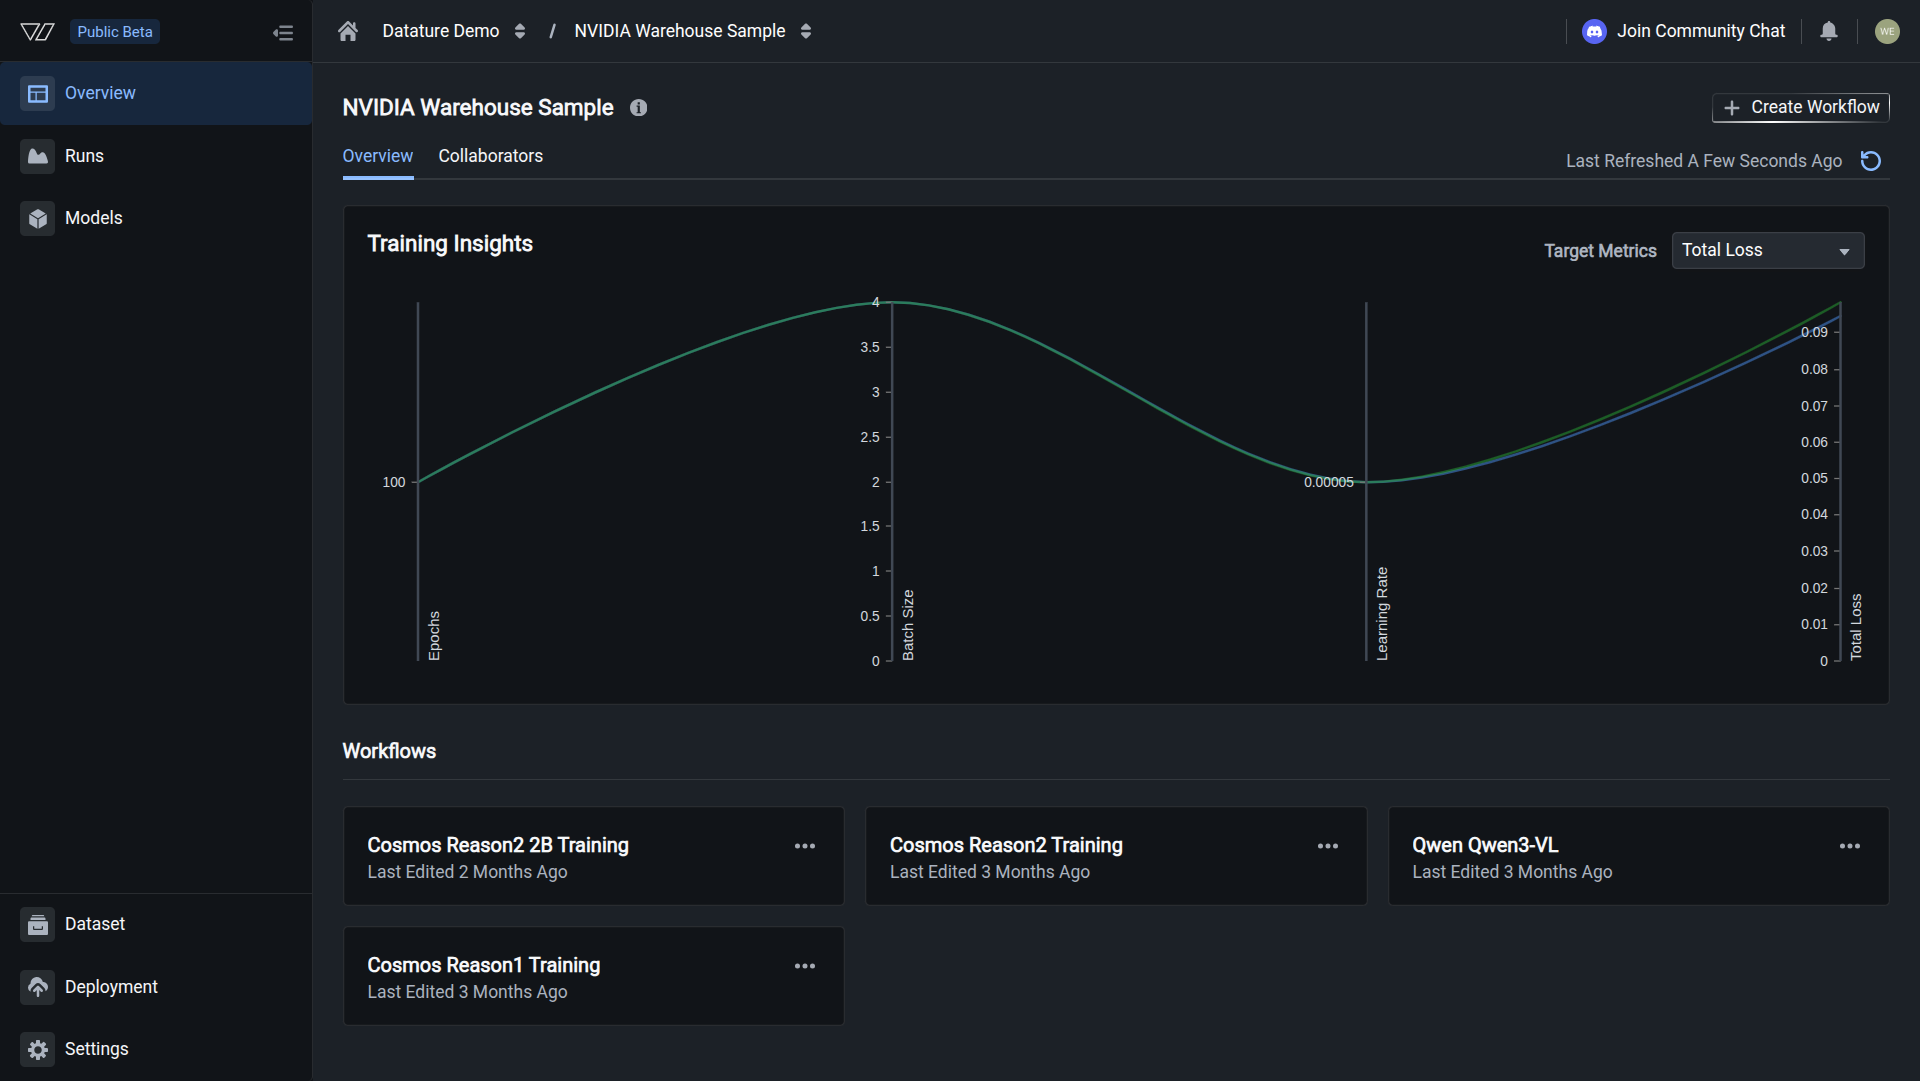
Training Insights
The Training Insights chart is a multi-axis curve comparison that plots three training configuration parameters (epochs, batch size, and learning rate) alongside a selected performance metric. Each axis has its own scale, so you can see at a glance how different configurations correlate with metric outcomes across your runs.
The three configuration axes are always visible:
- Epochs (left axis) shows the number of full passes over the dataset for each run.
- Batch Size (center-left axis) shows the batch size used in each run's configuration.
- Learning Rate (center-right axis) shows the learning rate value for each run.
Use the Target Metrics dropdown in the top-right corner to select which performance metric appears on the rightmost axis. The available metrics depend on your project's task type and match those described in Training Metrics. For example, a phrase grounding project offers Total Loss, F1, IoU, Precision, and Recall, while a VQA project includes BLEU, BERTScore, METEOR, and ROUGE.
Reading the chart
Each curve represents a training run. Compare the curves to spot which configuration combinations produce lower loss or higher evaluation scores. If two runs share the same batch size and epochs but differ in learning rate, the chart shows which learning rate led to a better metric value.
Hover over any point on a curve to see exact values for all four axes at that position.
Training Insights only appear after you complete at least one training run. A new project displays an empty chart until the first run reports metrics.
Workflows
The Workflows section lists every workflow created within the project. Each workflow card shows the workflow name and a "Last Edited" timestamp.
Click any workflow card to open it and view or modify its configuration (system prompt, dataset, model settings). The three-dot menu on each card provides quick actions to rename, duplicate, or delete the workflow.
To add a new workflow, click Create Workflow in the top-right corner of the page. This opens the workflow canvas where you connect system prompt, dataset, and model nodes. See Create a Workflow for the full setup process.
Sidebar navigation
The left sidebar inside a training project has three tabs:
Below the project tabs, a Settings tab at the bottom of the sidebar gives you access to training project management actions like renaming and deletion. See Manage Training Projects for details.
Collaborators
Switch to the Collaborators tab (next to Overview) to view and manage who has access to this training project. Collaborators inherit permissions from your organization's team settings.
Next steps
Updated 2 months ago