Advanced Evaluation

Compare ground truth annotations with model predictions side-by-side across training checkpoints.

Before You Start

New runs go through a cold start period (dataset preprocessing, instance startup, and pending first metrics) before any predictions appear on this tab.

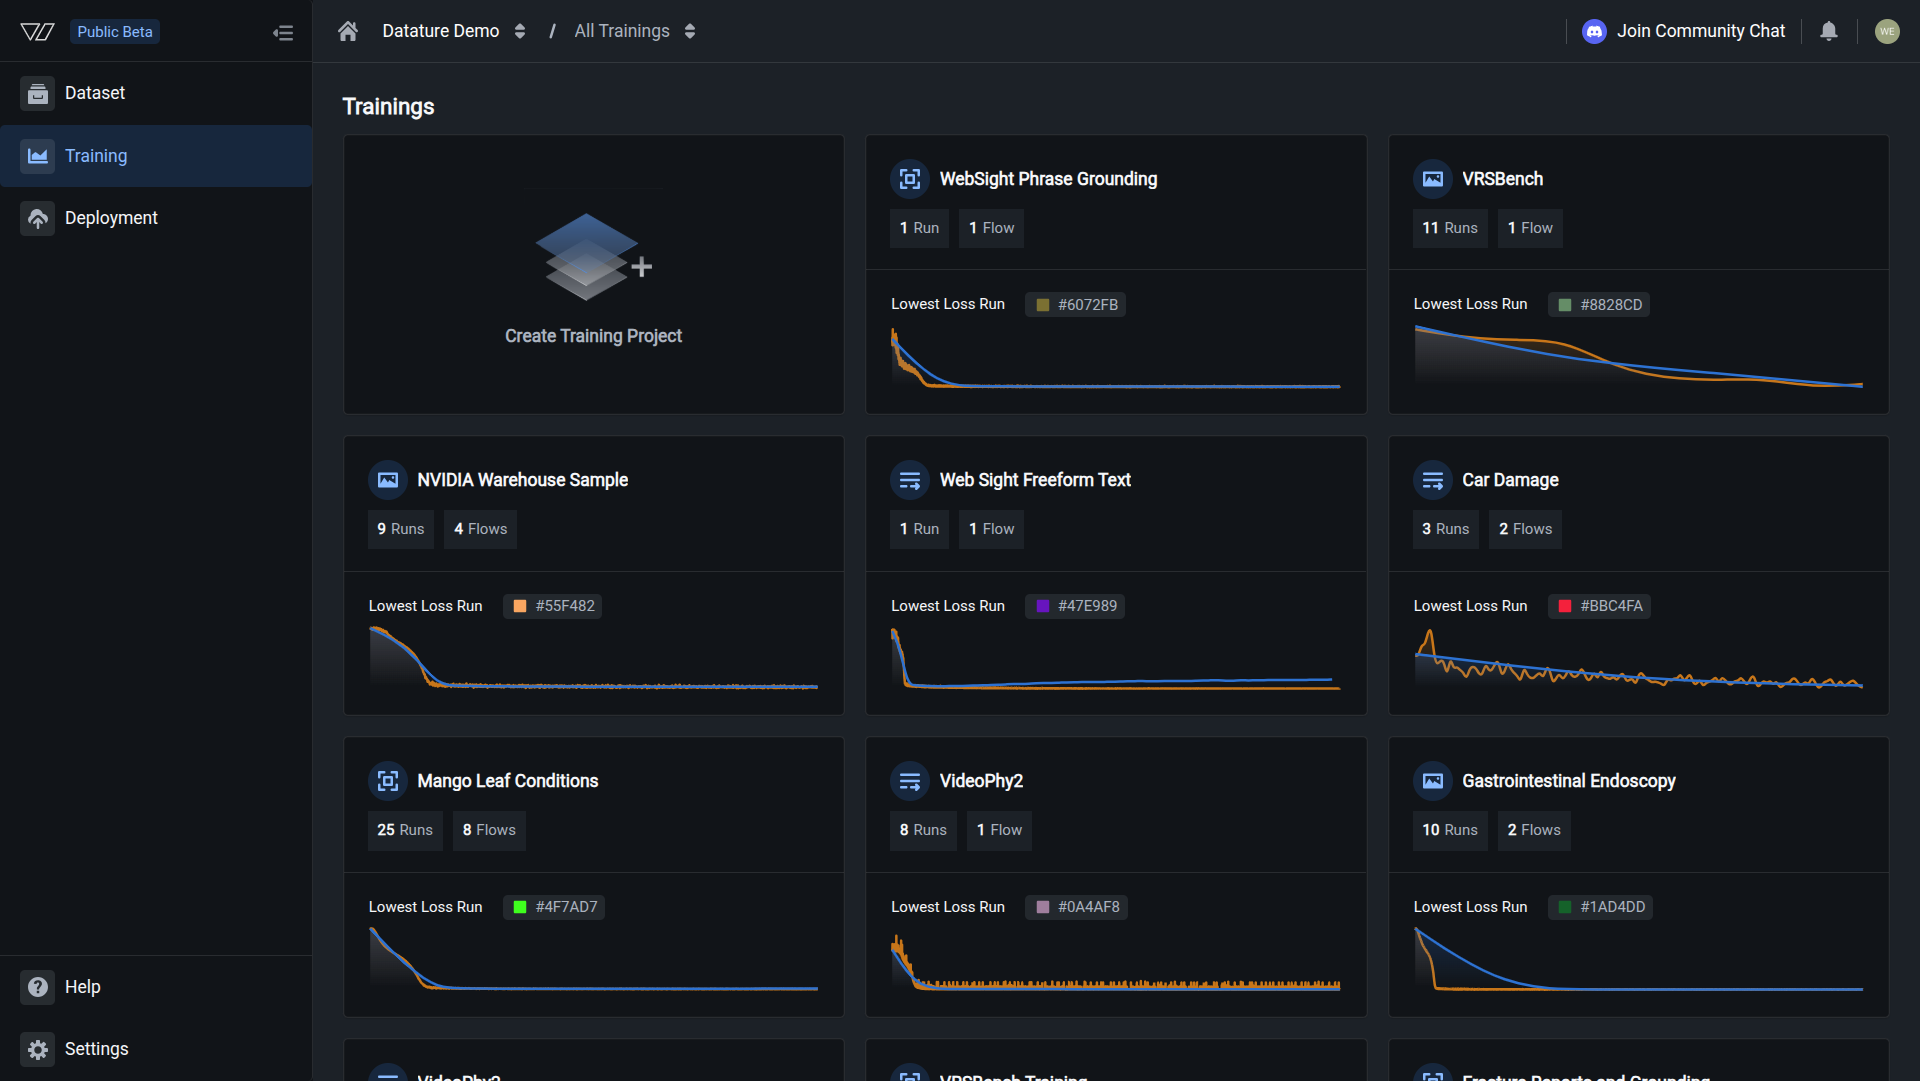
The Advanced Evaluation tab in Datature Vi shows model predictions alongside ground truth annotations for each validation image. Where Training Metrics gives you numbers, Advanced Evaluation shows you the actual predictions so you can see exactly where the model succeeds and where it fails.

1

Open your training project

Open your training project

Go to Training in the sidebar and click the project containing the run you want to review.

You should see
The Advanced Evaluation tab showing a validation image with ground truth annotations on the left matching closely with model predictions on the right

Your evaluation is complete when you can step through validation images and confirm that predicted bounding boxes or text answers align with ground truth across checkpoints.

What you see in the tab

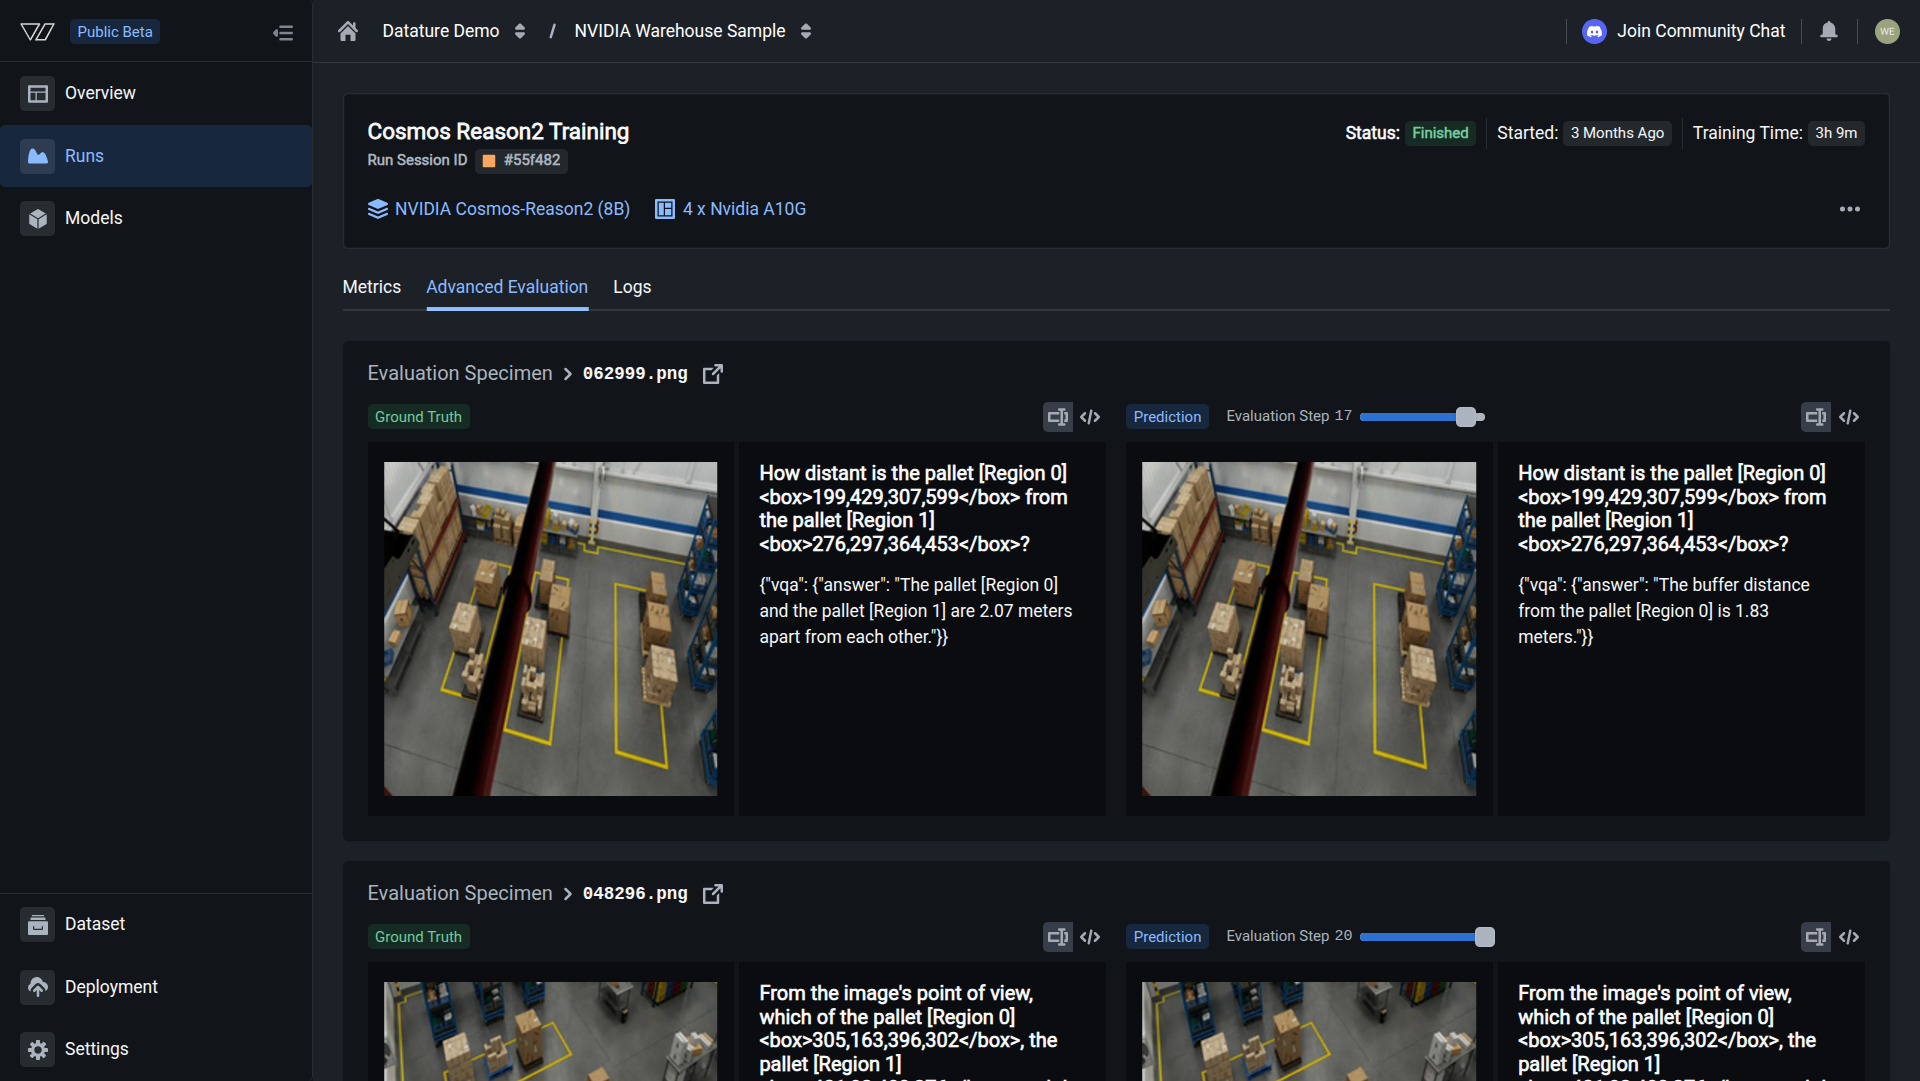
Each validation image (called an evaluation specimen) appears with two panels side by side:

  • Left panel (Ground Truth): your original annotations from the dataset
  • Right panel (Prediction): the model's predicted annotations or generated text at the selected checkpoint
  • Specimen identifier: the filename of the evaluation image

The image list on the side lets you scroll through all validation specimens. Click any one to load its comparison.

Step through evaluation checkpoints

Training saves evaluation results at multiple points during the run. The checkpoint slider lets you step through these snapshots to see how the model's predictions changed over time.

To change the checkpoint:

  1. Click the three dots (•••) in the top-right corner of the Advanced Evaluation tab
  2. An Evaluation Step slider appears
  3. Drag the slider to the checkpoint you want (for example, Step 0, 5, 10, 15, or 20)
  4. Both panels update to show predictions at that training stage

What the stages typically look like:

  • Early checkpoints (Steps 0–5): predictions are often inaccurate or incomplete; the model has barely started learning
  • Middle checkpoints (Steps 5–15): predictions improve progressively as training continues
  • Final checkpoints (Steps 15–20): mature predictions at the end of training

During training, the model periodically saves its state and runs predictions on validation data. Each saved state is a checkpoint.

The frequency of these saves is configured in Advanced Settings when you launch the run:

  • More frequent: more granular view of how predictions improve (for example, every 50 steps)
  • Less frequent: faster training with fewer evaluation passes (for example, every 500 steps)

Step numbers represent training iterations, not epochs. One step processes one batch of data. Example: 1,000 images divided by a batch size of 8 equals 125 steps per epoch.

How to interpret predictions

What counts as a good prediction depends on your task type.

Phrase grounding tasks

For phrase grounding tasks, you are comparing bounding boxes.

What you see
What it means
Action
Boxes tightly aligned with objects
Good localization
No action needed
Boxes much larger than objects (loose)
Low IoU; poor localization
Add training examples with tight annotations
Objects in ground truth but not predicted
Low recall; missed detections
Increase training data for underrepresented classes
Boxes on background or wrong objects
Low precision; false positives
Add negative examples (images without target objects)
Some boxes accurate, others misaligned
Inconsistent localization
Improve annotation consistency and data diversity

Visual question answering tasks

For visual question answering tasks, you are comparing generated text against reference answers.

What you see
What it means
Action
Generated text matches ground truth meaning
Good prediction
No action needed
Model invents details not visible in the image
Hallucination
Add more diverse training data; refine [system prompt](doc:configure-your-system-prompt) for grounded responses
Answer is missing key information
Incomplete answer
Add complete-answer examples to system prompt
Answer format is wrong (too verbose or too brief)
Format mismatch
Clarify expected answer format in system prompt
Wrong confidence on uncertain situations
Ambiguity handling failure
Add training examples demonstrating uncertainty handling

Frequently asked questions

Vi does not have a built-in multi-run comparison view. The practical approach is to open each run in a separate browser tab, go to the same checkpoint step in both, then click the same validation specimen in each tab to compare predictions manually.

The number of available checkpoints depends on the checkpoint frequency you configured before the run started. A higher frequency saves more checkpoints and gives more steps on the slider. A lower frequency saves fewer. You cannot change this after the run finishes. See checkpoint frequency settings.

Yes, this is a strong overfitting signal. If predictions at an intermediate checkpoint are more accurate than predictions at the final checkpoint, the model peaked before training ended. The best checkpoint to use is the one where validation predictions looked best, not necessarily the final one. Cross-reference with the loss curves in Training Metrics to confirm the pattern.

No. For visual question answering tasks, the model generates text answers rather than bounding boxes. Text in the prediction panel is the expected output for those tasks. Bounding boxes appear only for phrase grounding tasks.

Next steps

Training Metrics

Read loss curves, F1, IoU, BLEU, and BERTScore to quantify model performance.

Download a Model

Export your trained VLM weights and deploy them outside of Datature Vi.

How Do I Evaluate My Model?

Understand the core concepts behind VLM evaluation, from metrics to visual analysis.