Monitor a Run
Track real-time training progress, read live loss charts, and catch errors before they waste compute credits.
Monitoring a run in Datature Vi lets you watch training progress in real time, read loss charts as they update, and spot configuration errors before they consume your compute credits. You can also review completed runs to understand what happened during training.
An active training run (status: Running, Queued, or Starting), or a completed run to review.
Open your training project
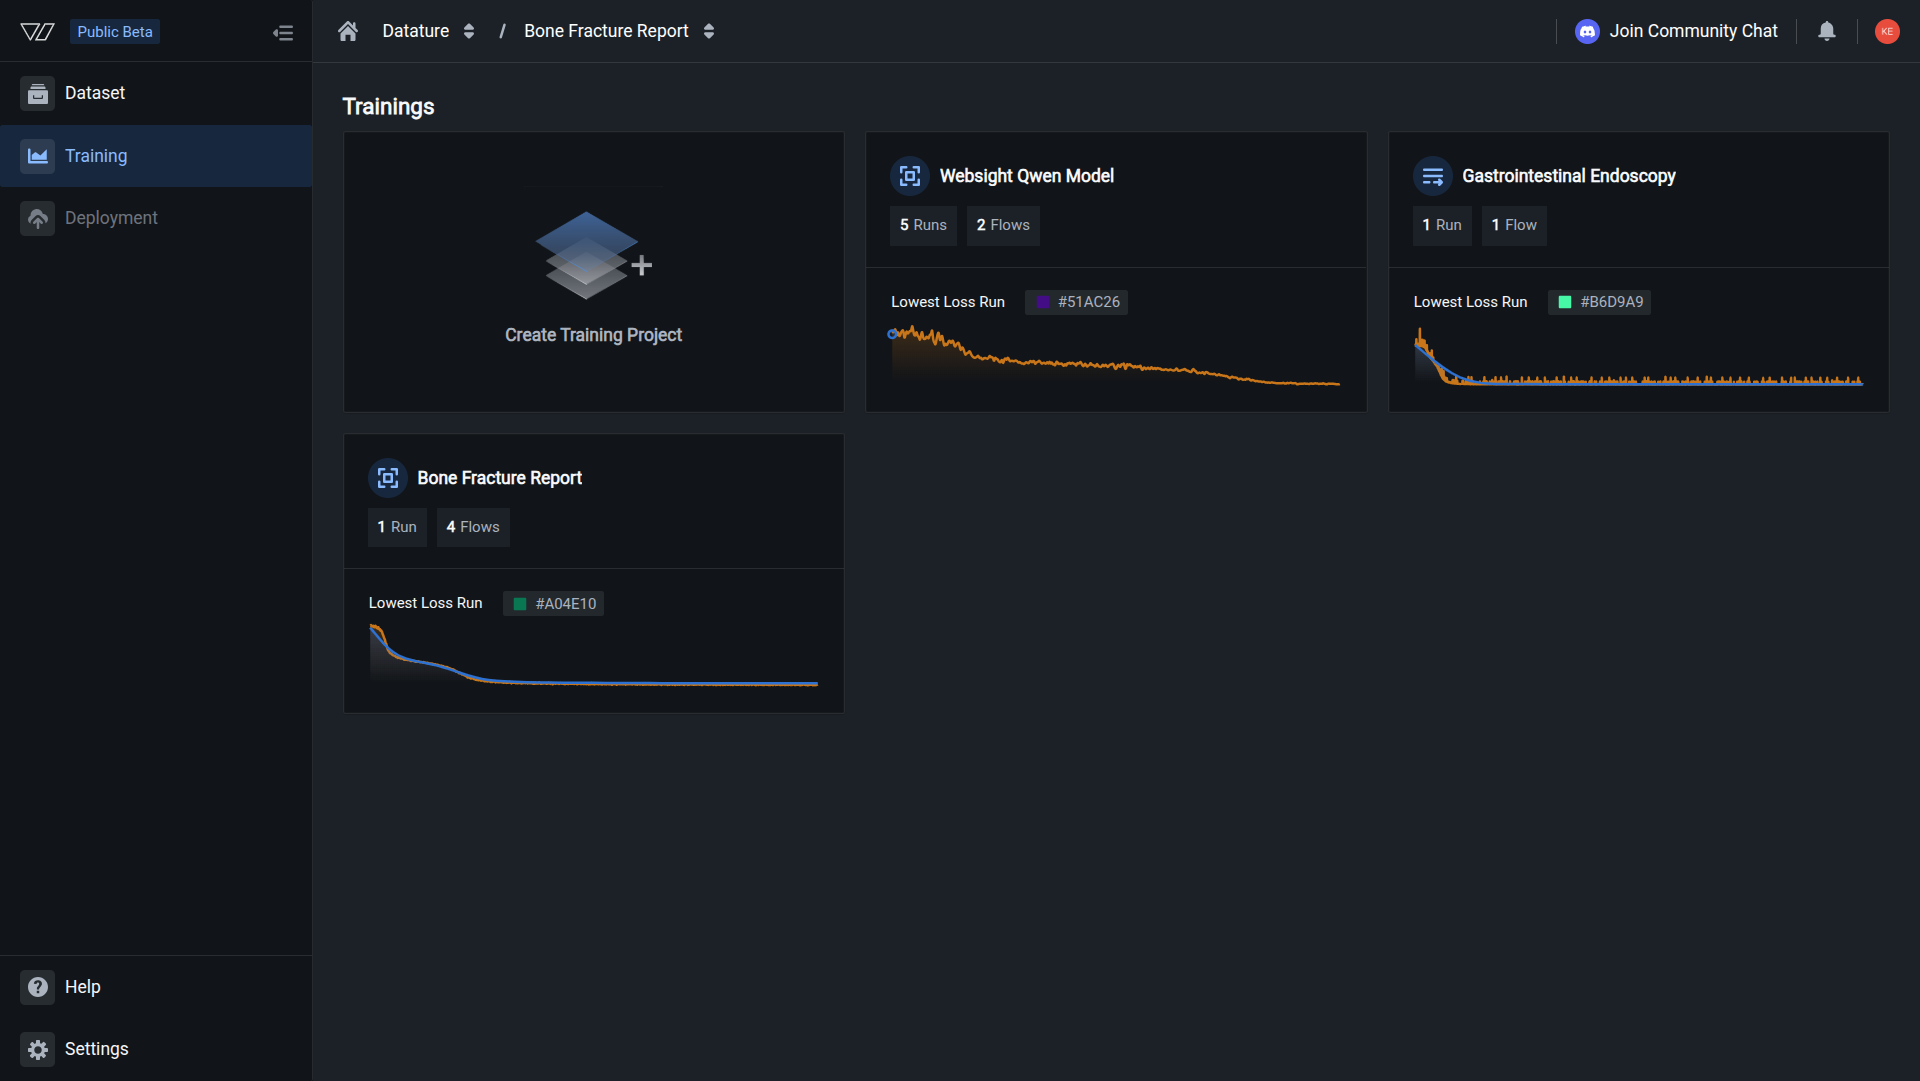
Go to Training in the sidebar and click the project containing the run you want to review.
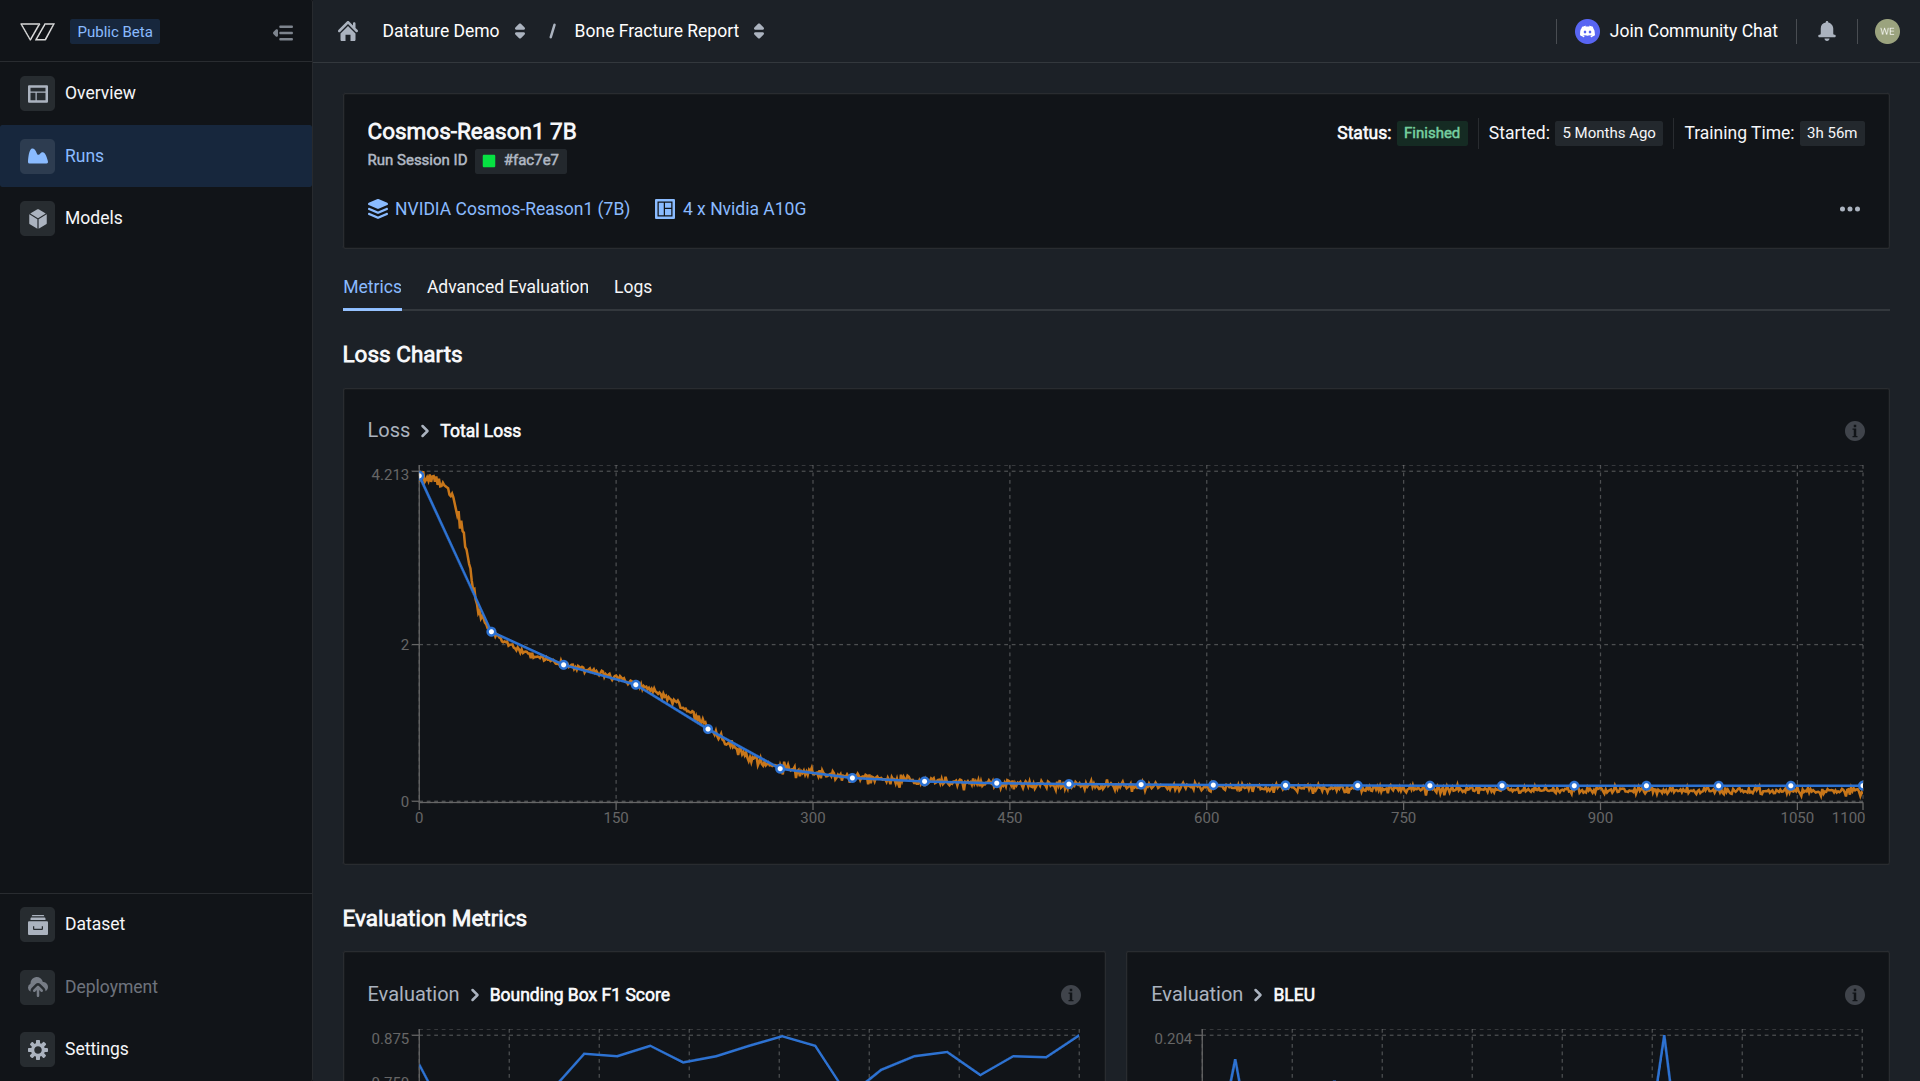
Loss is decreasing steadily and metrics are updating after each epoch. Training is progressing as expected.
Training stages
Every run moves through three stages before active training begins. Each stage can take a different amount of time depending on your dataset size and GPU availability.
Preprocessing dataset (1-5 minutes)
Datature Vi validates your dataset, checks annotation formats, applies the train-validation split, and prepares the data for the selected model architecture. If this stage fails, the issue is usually a dataset configuration problem: missing annotations, incompatible formats, or an empty split.
Spinning up instance (2-5 minutes)
The platform allocates GPU hardware matching your selection. Wait times depend on GPU availability. If this stage takes longer than 10 minutes, the selected GPU type may be temporarily unavailable. Contact support if it persists.
Pending first metrics (5-30 minutes)
The model has loaded and training has started, but no evaluation checkpoint has been reached yet. The time depends on your dataset size, batch size, and evaluation interval. Once the first evaluation completes, loss charts and metrics appear on the Metrics tab.
Evaluate your model
Once metrics are available, the cold start view is replaced by three evaluation tabs:
Training Metrics
Loss curves, task-specific scores (F1, IoU, BLEU, BERTScore), and hyperparameter values. Check whether the model is learning and compare runs.
Advanced Evaluation
Side-by-side comparison of ground truth annotations and model predictions across checkpoints. Spot failure patterns visually.
Training Logs
Full run output with timestamps. Debug errors, trace OOM issues, or confirm that preprocessing completed correctly.
See Evaluate a Model for a walkthrough of all three tabs.
Handle training errors
When a run fails or hits a problem like an out-of-memory (OOM) error, the run status badge at the top of the page updates to reflect the error state (for example, Out of Memory or Failed). Click the status badge to expand an error card that shows the message "The training failed with the following error(s)", along with timestamps and a description of what went wrong.
The Training Progress tracker below the error card shows which cold start stage the run reached before it failed. Use this to narrow down the cause. A failure at the dataset preprocessing stage points to a data or annotation issue, while a failure after the instance is ready usually means a model configuration or resource problem.
Common errors and fixes:
- Out of memory: The training process tried to allocate more CPU or GPU memory than available. Select a larger GPU type, increase the GPU count, or reduce the batch size.
- Dataset preprocessing failure: Annotation format issues or an empty train/validation split. Check your dataset configuration and re-upload if needed.
When to kill a run
Not every run is worth finishing. Kill a run early if:
- Loss has stopped decreasing for many consecutive epochs
- You see
NaNvalues in the loss output - Out-of-memory errors repeat across multiple steps
- You realize the configuration is wrong (wrong dataset, wrong model size)
Killing a run frees your GPU immediately and stops compute credit consumption. See Kill a run for the steps.
Run status reference
Do this with the Vi SDK
import vi

client = vi.Client(
    secret_key="your-secret-key",
    organization_id="your-organization-id"
)

run = client.runs.get("your-run-id")
if run.status.conditions:
    latest = run.status.conditions[-1]
    print(f"Status: {latest.condition.value}")
    print(f"Message: {latest.message}")
For more details, see the full SDK reference.