
Dataset Overview
Navigate your dataset dashboard to view asset statistics, annotation distribution, and aggregated heatmaps in Datature Vi.
The dataset overview is your central dashboard for a single dataset. It shows asset statistics, annotation counts, and aggregated visual heatmaps that reveal spatial and dimensional patterns across your data. This is the right place to check before starting a training run or after a large batch of changes.
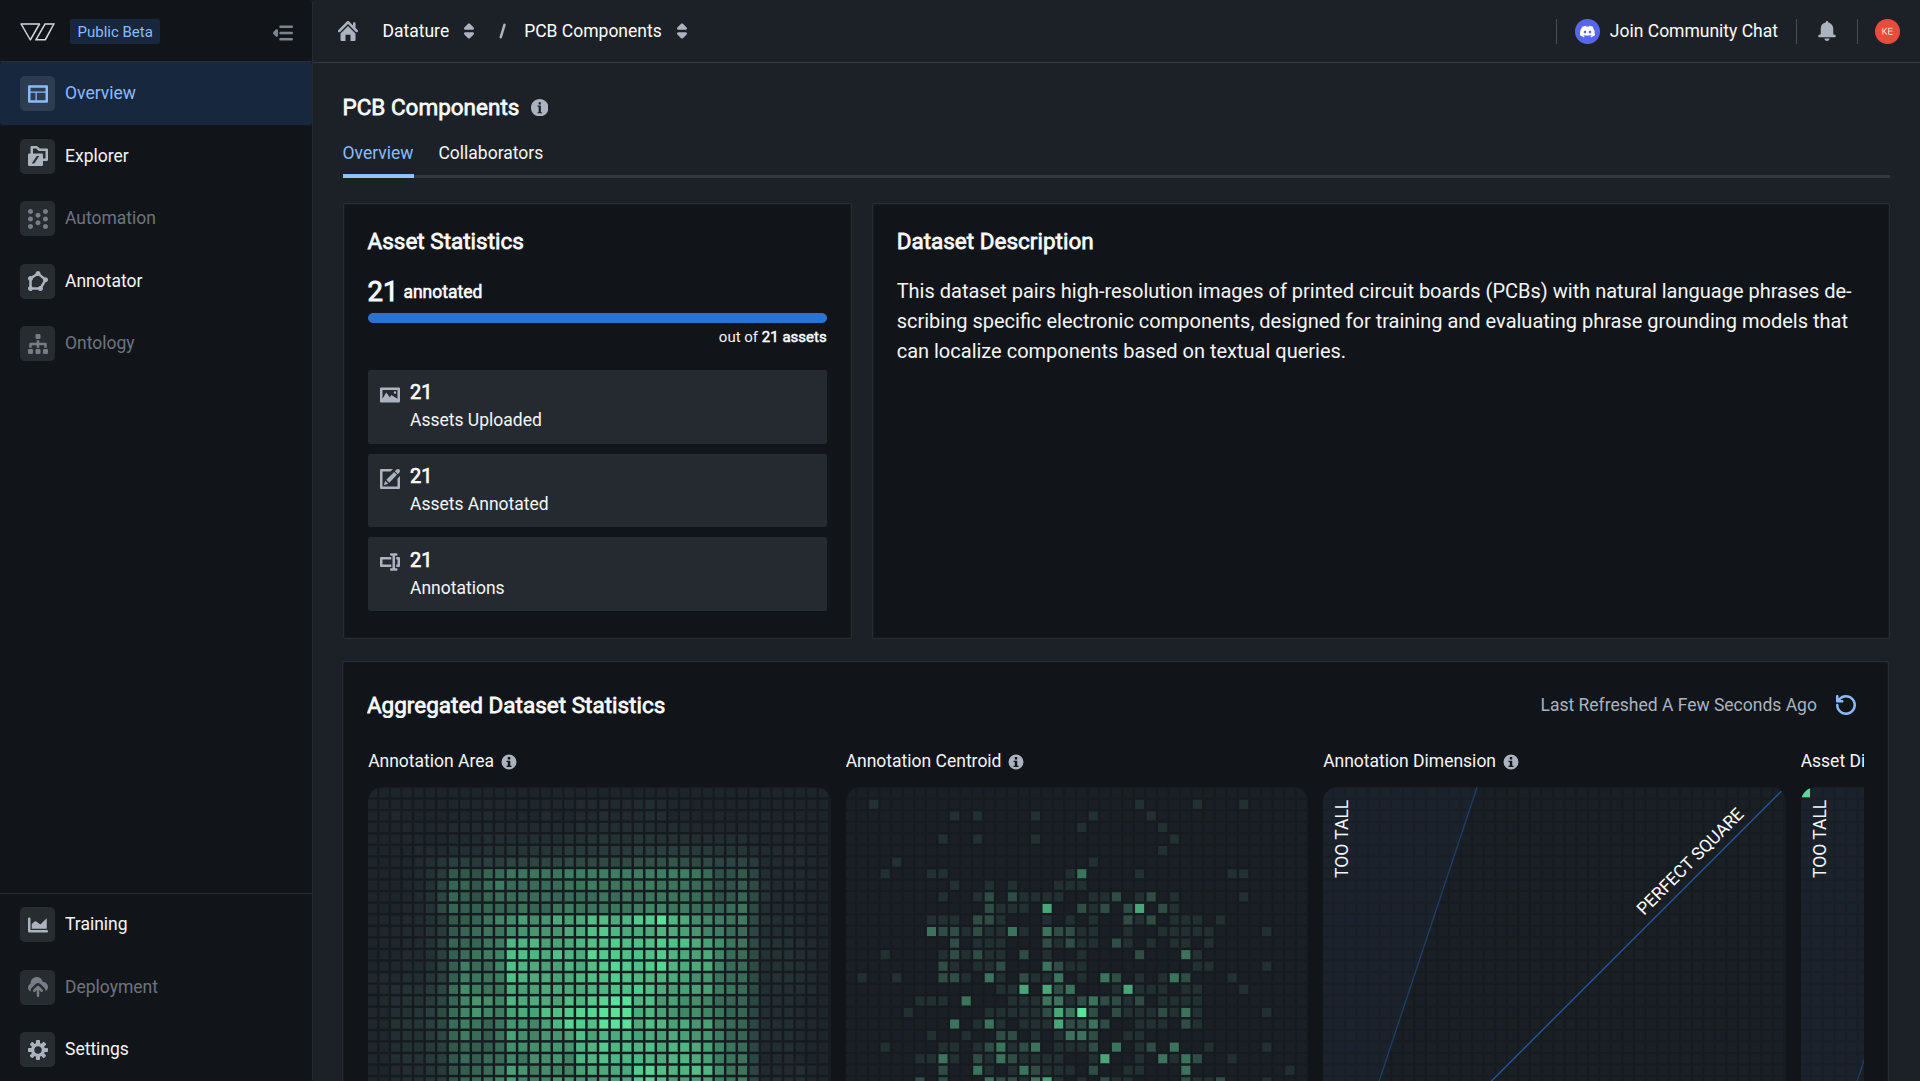
Asset Statistics
The Asset Statistics panel displays three counts:
- Assets Uploaded - the total number of images in your dataset.
- Assets Annotated - how many of those images have at least one annotation. A progress bar shows the ratio of annotated to total assets.
- Annotations - the total number of individual annotations across all assets.
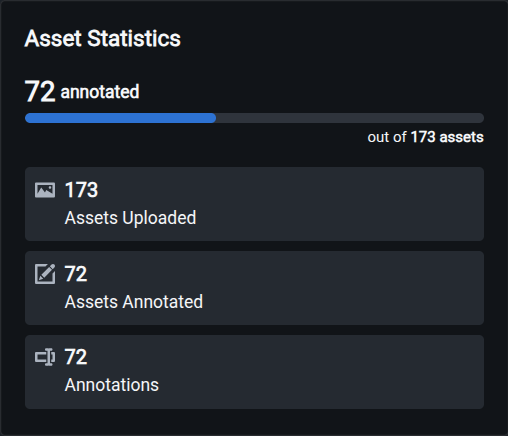
If the annotated count is much lower than the uploaded count, a large portion of your dataset still needs labeling. A dataset with many assets but few annotations will not produce a strong model.
Aggregated Dataset Statistics
This section shows heatmap visualizations that help you understand spatial and dimensional patterns in your data. The charts available depend on your dataset type. Phrase grounding datasets show all five charts. All other task types show only the Asset Dimension chart.
Annotation Area

The distribution of annotations across all images in the dataset. Each cell in the heatmap represents a region of the image canvas. The color intensity corresponds to the concentration of annotations in that region. A heavily concentrated area suggests your annotations cluster in one part of the frame, which could bias the model toward detecting objects only in that zone.
Annotation Centroid

The count of annotation centroids at specific positions across all images in the dataset. The color intensity corresponds to the concentration of annotation centroids at specific positions in space. This chart helps you spot whether your labeled objects tend to sit in the center of every image or spread across different positions.
Annotation Dimension
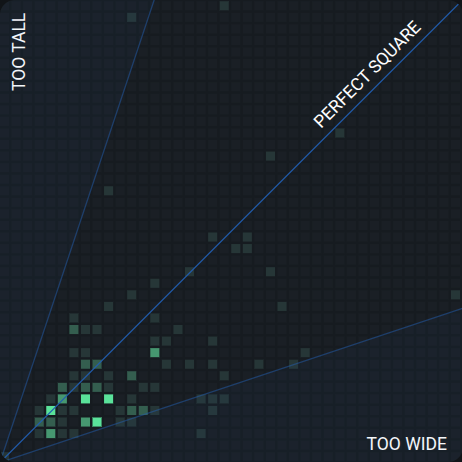
The normalized dimensions of bounding boxes in space. The color intensity corresponds to the concentration of bounding boxes with similar dimensions. For mask datasets, box boundaries are used for the calculation. The diagonal "Perfect Square" line marks where width equals height. Points clustered in the "Too Tall" or "Too Wide" zones tell you whether your annotations skew toward one aspect ratio.
Asset Dimension
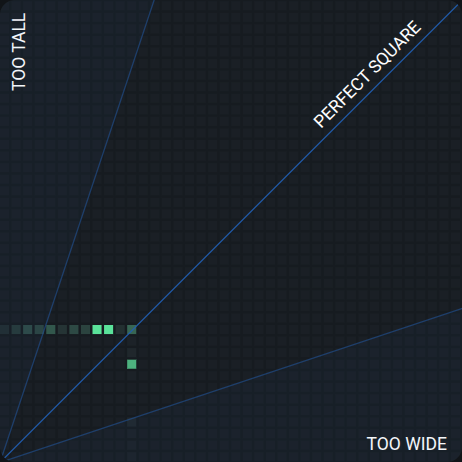
The ratio of each image's width to its height. The color intensity corresponds to the concentration of images with similar dimensions. Like Annotation Dimension, this chart includes "Too Tall," "Too Wide," and "Perfect Square" reference lines. If most of your images cluster in one corner, your dataset may lack variety in image shapes, which can affect how well the model generalizes to different aspect ratios.
Phrase to Caption

The ratio of phrase length to caption length. The color intensity corresponds to the concentration of phrases with similar lengths to captions. This chart is only available for phrase grounding datasets. It shows whether your phrases tend to be short keywords or longer descriptive segments relative to the full caption.
Only phrase grounding datasets display all five aggregated statistics charts. For all other dataset types (object detection, segmentation, visual question answering, freeform), only the Asset Dimension chart appears.
Sidebar navigation
The left sidebar inside a dataset has five tabs:
Below the main tabs, a Settings tab at the bottom of the sidebar gives you access to dataset management actions like renaming and deletion. See Manage Datasets for details.
When to check the overview
Check this page at these points in your workflow:
- Before training: Verify you have enough annotations and a reasonable class distribution.
- During annotation: Track coverage and identify which categories still need work.
- After cleanup: Confirm that bulk deletions improved the dataset without creating new gaps.
- Quality assurance: Spot outliers or anomalies that suggest labeling errors.
Common scenarios
Insufficient annotations
If the annotation count is too low for training, you can add more annotations manually, upload existing annotations if you have them, or use the AI-assisted annotation tools to speed up labeling.
Class imbalance
Collect more data for underrepresented classes, or remove excess samples from overrepresented classes using bulk actions. You can also adjust the dataset split strategy in Configure Your Dataset.
Missing annotations
Complete the annotation workflow for unannotated assets, or remove them using bulk actions if they are not needed.
Do this with the Vi SDK
import vi

client = vi.Client(
    secret_key="your-secret-key",
    organization_id="your-organization-id"
)

dataset = client.datasets.get("your-dataset-id")
print(f"Assets: {dataset.statistic.asset_total}")
print(f"Annotated: {dataset.statistic.asset_annotated}")
print(f"Annotations: {dataset.statistic.annotation_total}")
For more details, see the full SDK reference.
Next steps
Updated 7 months ago