Logs
Review detailed training logs, debug errors, and troubleshoot failed runs.
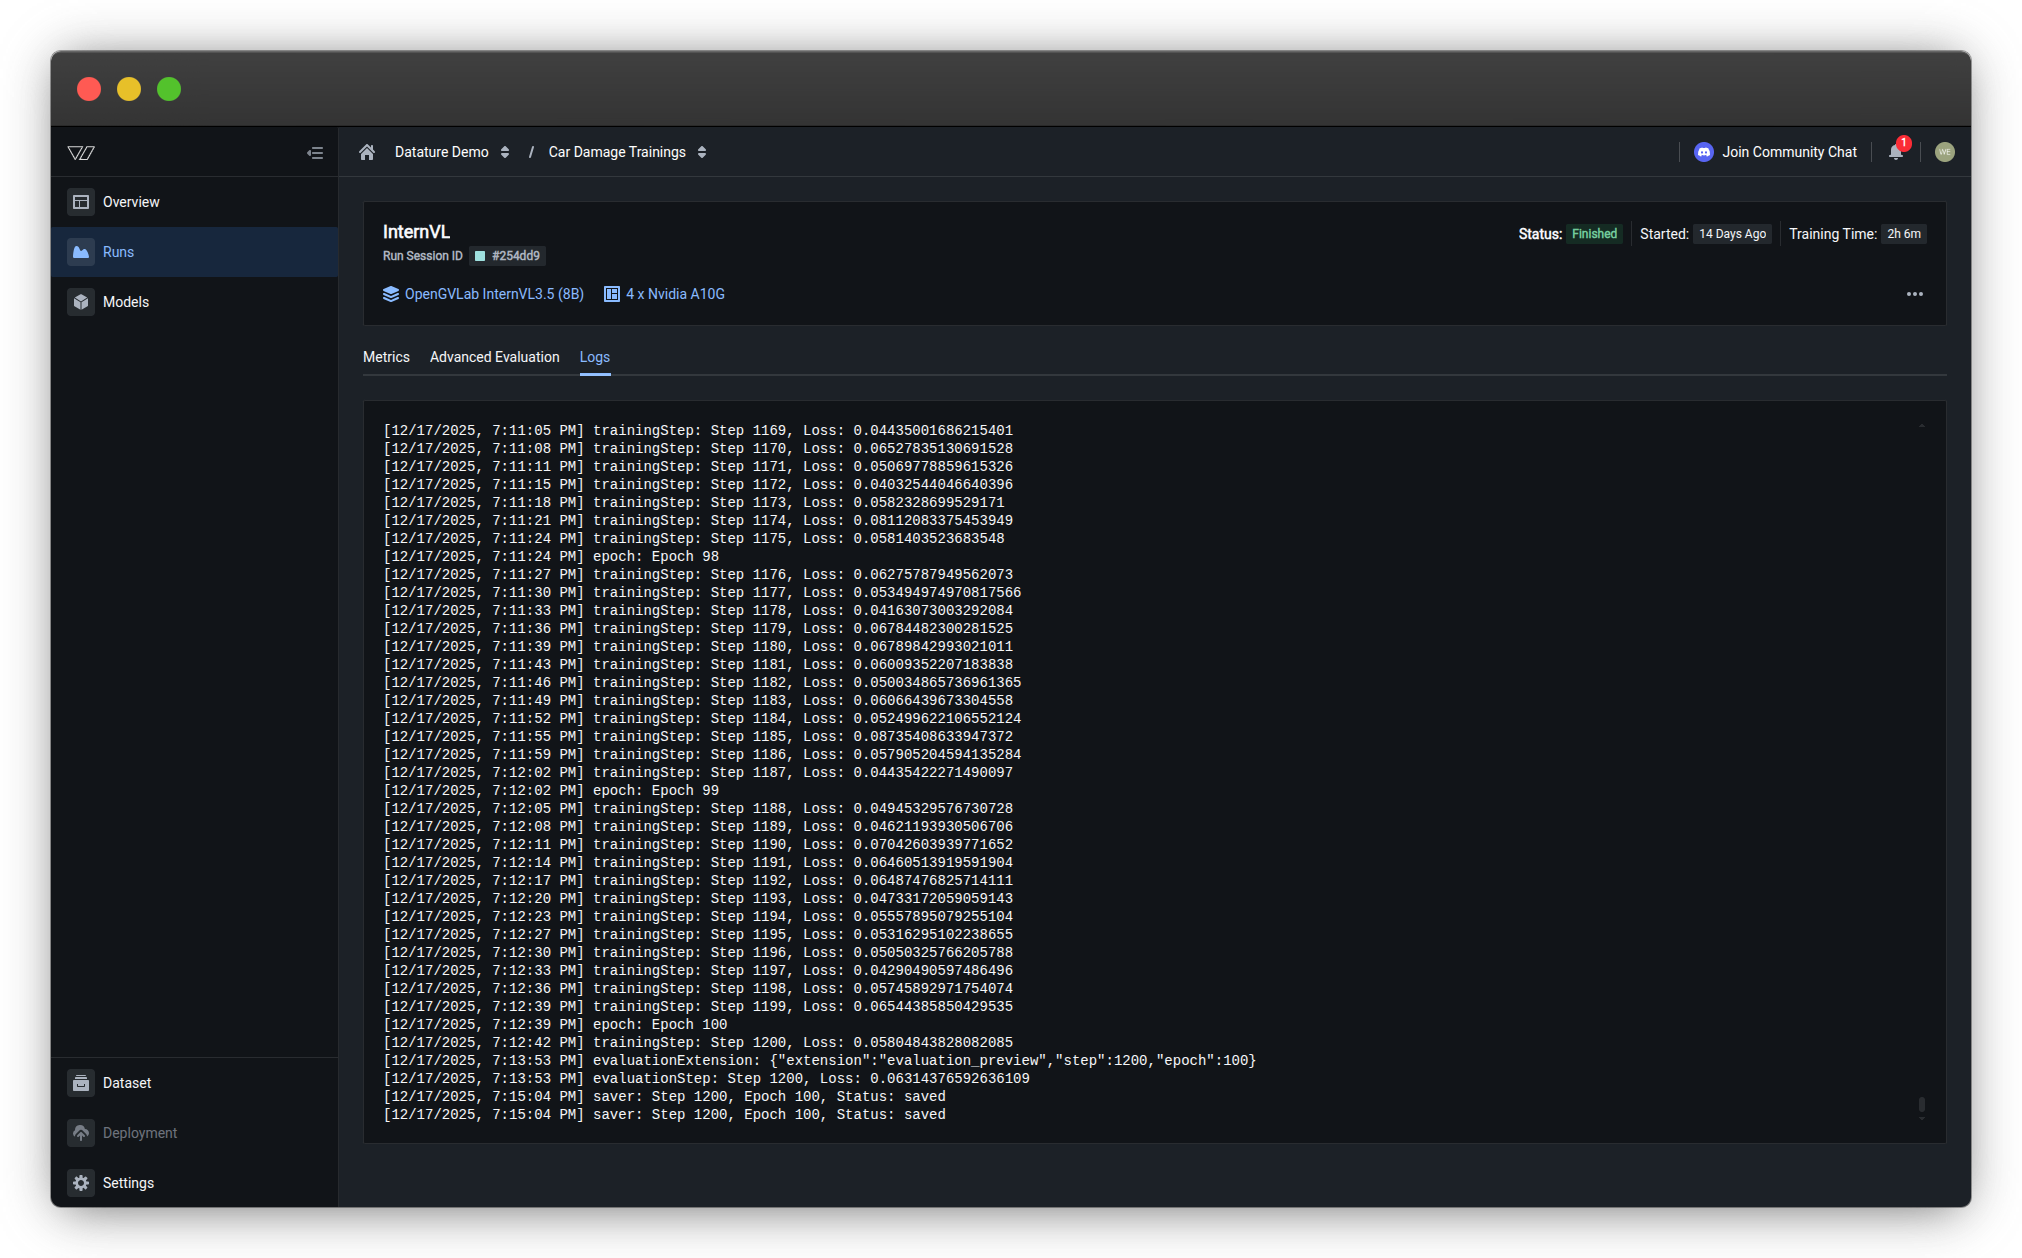
The Logs tab displays complete training output including system messages, training steps, loss values, and evaluation results. Use logs to debug issues, track progress, and troubleshoot errors.
Access logsOpen any training run and click the Logs tab to view detailed training output and error messages.
Log content
Training logs include:
| Log Type | Example | Purpose |
|---|---|---|
| Training steps | trainingStep: Step 1169, Loss: 0.84435061686215401 | Monitor progress and loss per step |
| Epochs | epoch: Epoch 98 | Track training rounds through dataset |
| Evaluation | evaluationExtension: {"extension":"evaluation_preview","step":1200,"epoch":100} | Checkpoint evaluation triggers |
| Saver events | saver: Step 1200, Epoch 100, Status: saved | Model checkpoint saves |
Use logs for troubleshooting
Training won't start or crashes
Check logs for:
- Out of memory errors — GPU memory exhausted; reduce batch size or use larger GPU
- Dataset errors — Missing or corrupted files; verify dataset integrity
- Configuration errors — Invalid hyperparameter combinations; check model settings
Common error patterns:
CUDA out of memory
RuntimeError: Expected tensor for argument #1 'indices' to have scalar type Long
ValueError: Invalid annotation format
Training is very slow
Check logs for:
- Long step duration — Compare
trainingSteptimestamps; slow steps indicate bottlenecks - Frequent checkpointing — Checkpoints slow training; adjust checkpoint frequency
- Data loading delays — Large images or slow storage; consider preprocessing or faster storage
Typical step times:
- 1-2 seconds/step — Normal for most configurations
- 5-10 seconds/step — Slow; investigate GPU utilization or data loading
- >10 seconds/step — Very slow; likely misconfiguration or resource constraints
Loss isn't decreasing
Check logs for:
- Initial loss value — Unusually high (>10.0) may indicate data scaling issues
- NaN loss —
Loss: nanmeans training collapsed; reduce learning rate - Consistent loss — No change across many steps; learning rate too low or data issues
Diagnostic steps:
- Verify loss starts at reasonable value (2.0-6.0)
- Confirm loss decreases within first 100 steps
- Check for sudden spikes or NaN values
- Review hyperparameter settings
Download logsTo save logs for external analysis or sharing with support:
- Click the three dots (•••) in the top-right corner of the Logs tab
- Select Download logs
- Logs are saved as a
.txtfile with timestamp
Compare multiple runs
Systematic comparison helps identify which configuration changes improve performance.
Comparison workflow
Compare metrics across runs
Create a comparison table:
| Run | Model | Learning Rate | Final Loss | Bbox F1 | BLEU |
|---|---|---|---|---|---|
| Run 1 | Qwen2.5-VL 2B | 3e-4 | 0.82 | 0.78 | 0.45 |
| Run 2 | Qwen2.5-VL 7B | 3e-4 | 0.64 | 0.85 | 0.52 |
| Run 3 | Qwen2.5-VL 7B | 1e-4 | 0.58 | 0.88 | 0.56 |
Analysis:
- Run 1 → Run 2: Larger model improves all metrics
- Run 2 → Run 3: Lower learning rate further improves convergence
Conclusion: Qwen2.5-VL 7B with learning rate 1e-4 is optimal configuration.
Compare visual predictions
For each configuration:
- Open Advanced Evaluation for the run
- Navigate to the same evaluation specimen across runs
- Compare predictions side-by-side (manually or via screenshots)
What to compare:
- Bounding box quality — Tightness, completeness, false positives
- Text generation — Accuracy, completeness, formatting
- Consistency — Performance across different image types
- Edge case handling — Behavior on difficult examples
Document findings: Note which configuration handles specific scenarios better.
Systematic experimentation
Best practice: Change one variable at a time
❌ Bad approach:
- Run 1: Model A, learning rate 3e-4, batch size 8, epochs 3
- Run 2: Model B, learning rate 1e-4, batch size 16, epochs 5
Impossible to determine which change caused improvements
✅ Good approach:
- Run 1 (baseline): Model A, learning rate 3e-4, batch size 8, epochs 3
- Run 2: Model B, learning rate 3e-4, batch size 8, epochs 3 (only model changed)
- Run 3: Model B, learning rate 1e-4, batch size 8, epochs 3 (only learning rate changed)
- Run 4: Model B, learning rate 1e-4, batch size 16, epochs 3 (only batch size changed)
Clear cause-and-effect relationships
Understanding overfitting
Overfitting occurs when a model memorizes training data instead of learning general patterns. The model performs well on training data but poorly on new, unseen images.
Signs of overfitting
Loss value indicators
Training loss vs. validation loss:
✅ Healthy training:
Both training and validation values decrease together. Validation stays close to training loss throughout the entire training process, indicating the model is learning generalizable patterns rather than memorizing.
⚠️ Problematic training (overfitting):
Key indicator: Training loss continues decreasing while validation loss plateaus or starts increasing. The gap between the two values widens over time.
What's happening:
-
Training loss keeps improving but validation loss stops improving or gets worse
-
Model is memorizing training data instead of learning generalizable patterns
-
Occurs with extended training, overly complex models, or insufficient data
Solutions: Stop training earlier (use early stopping), reduce model complexity, add regularization, or increase dataset size.
Metric degradation
Check evaluation metrics over checkpoints:
⚠️ Overfitting signs:
- Metrics improve on training set but degrade on validation set
- Metrics peak at early checkpoint, then decline
- Large gap between train and validation performance
Example:
| Checkpoint | Train F1 | Validation F1 | |
|---|---|---|---|
| Step 500 | 0.75 | 0.72 | ✅ Healthy |
| Step 1000 | 0.85 | 0.80 | ✅ Healthy |
| Step 1500 | 0.92 | 0.78 | ⚠️ Overfitting |
| Step 2000 | 0.97 | 0.74 | ❌ Severe overfitting |
Visual prediction issues
⚠️ Overfitting behaviors:
- Model performs perfectly on training images but poorly on validation images
- Predictions are overly specific to training examples (e.g., only detects objects in exact poses seen during training)
- Model fails on slight variations of training examples
- Performance degrades on images with different lighting, angles, or contexts than training data
Prevent and fix overfitting
Add more training data
Most effective solution:
- Increase dataset size (aim for 2× current size)
- Add diverse examples covering different:
- Lighting conditions
- Object orientations and poses
- Backgrounds and contexts
- Image quality and resolutions
Train for fewer epochs
Early stopping:
- Monitor validation metrics during training
- Identify checkpoint where validation performance peaks
- Stop training at or shortly after peak
- Use that checkpoint for deployment
Automatic early stopping:
Configure checkpoint frequency to save more checkpoints for granular stopping.
Adjust hyperparameters
Reduce model capacity:
- Use smaller model architecture (e.g., 2B instead of 7B)
- Lower learning rate
- Reduce training epochs
Increase regularization:
- Add dropout (if supported by architecture)
- Use stronger weight decay
Improve data quality
Quality over quantity:
- Fix annotation errors and inconsistencies
- Remove duplicate or near-duplicate images
- Balance class distribution
- Add hard negatives (challenging examples)
Troubleshooting
My training run failed. How do I troubleshoot?
Step-by-step troubleshooting:
1. Check the run status
Look at the status indicator on the Runs page:
- Out of Memory → Follow OOM troubleshooting
- Failed → Continue to step 2
- Killed → Run was manually stopped by user
2. View error details
Hover over "Additional Errors" to see error JSON:
{
  "condition": "LatticeExecutionFinished",
  "status": "FailedReach",
  "reason": "OutOfGpuMemory",
  "lastTransitionTime": "1764320567481"
}
Key field: reason tells you the root cause.
3. Check training progress
Look at which stage failed:
- Dataset Ready → Dataset or annotation errors
- Instance Ready → GPU or hardware issues
- Training Running → Training configuration or runtime errors
4. Review logs
Open the Logs tab and scroll to the end:
Look for these error patterns:
RuntimeError: CUDA out of memory
→ GPU memory exhausted; reduce batch size or use larger GPU

ValueError: Expected tensor for argument
→ Data format issue; check dataset annotations

FileNotFoundError: [Errno 2] No such file
→ Missing dataset files; verify uploads

RuntimeError: CUDA error: device-side assert triggered
→ Invalid operation; check hyperparameters
5. Common fixes by error type
| Error | Quick Fix |
|---|---|
| Out of Memory | Reduce batch size by 50% |
| Out of Quota | Refill Compute Credits; training resumes automatically |
| Dataset errors | Validate dataset; remove corrupted files |
| Configuration errors | Check system prompt syntax |
| Connection timeout | Retry training (usually resolves automatically) |
6. Retry with adjustments
- Create new run with fixed configuration
- Monitor closely during first few minutes
- Verify run progresses past previous failure point
Still stuck?
- Copy complete error message from Logs tab
- Note your configuration (model, GPU, batch size)
- Contact support with run details
Related resources
- Monitor a Run — Track progress and understand run statuses
- View Metrics — Analyze model performance
- Evaluate a Model — Complete evaluation guide
- Configure Training Settings — GPU and hardware configuration
- Resource Usage — Compute Credits and billing
Need help?
We're here to support your VLMOps journey. Reach out through any of these channels:
Updated 3 months ago